Category Archives: Data

New paper: “Distributional effects of welfare reform for young adults: An unconditional quantile regression approach”

In the spring of 2015, after having submitted my phd thesis, I attended an applied microeconometics course at the University of Oslo given by Monique de Haan, Tarjei Havnes and Edwin Leuven. I have previously blogged about a paper using the synthetic control method that grew directly out of that course. Now a second paper originating in a presentation in that course has been published:  “Distributional effects of welfare reform for young adults: An unconditional quantile regression approach,” Labour Economics, Volume 65, August 2020. The article is open access.

In the quantile regression class, I presented the paper “Is universal child care leveling the playing field?” by Havnes og Mogstad (Journal of Public Economics, Volume 127, July 2015). That paper uses several non-linear differences-in-differences methods to study the distributional effects of child care. One of their applied methods was the unconditional quantile regression approach of Firpo, Fortin and Lemieux (2009). At the time, I was working on the topic of welfare reform in Norway, and I realized that I could apply the same method to that question. That started a journey that now, 5 years later, has resulted in a published paper.

In the paper, I analyze what happened to earnings when Norwegian municipalities increased their use of conditions for (primarily young) welfare recipients. Of the age group I analyze in the paper (26–30 year olds), 8% received welfare at some time in 1993, the first year of the analysis. Welfare policy affects both those actually receiving welfare as well as a wider population with only a potential connection to the welfare system. I do not know exactly who is impacted, but the fact that changes in welfare policy mainly affect people with a low earning potential suggests going beyond the mean impact and analyzing the effects on the distribution. It is likely that the relatively small average effects mask an effect of higher earnings among low earners and no effects among high earners.

What do I find? Substantial positive effects of increased use of conditions in parts of the lower end of the earnings distribution for women and no or small negative effects for men. For women, earnings at the 20th percentile increase by around 25 percent, or € 2000 per year. As expected, there are no effects in the upper part of the distribution. Below is the key graph:
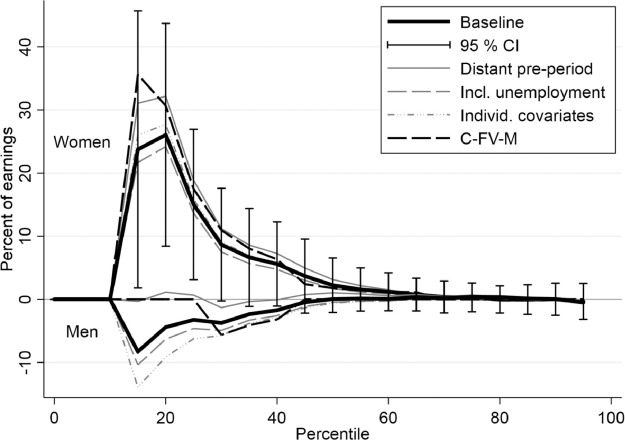

Fig. 3. Main quantile treatment effect estimates on earnings, 26–30 year olds.

Further, I find that although welfare payments decline, the effect on total income for women is also positive, indicating that they were able to find gainful employment that, overall, improved their financial circumstances.

I conclude that it is important to mention that the reform occurred in a beneficial environment, which may help to explain the good results. First, the reforming municipalities were responsible for undertaking and implementing the changes and therefore likely had a large degree of ownership of the reform and a strategy for implementing it. This may be hard to replicate in the case of changes mandated from a higher authority. Second, the social insurance offices had a large degree of discretion in deciding who should face conditions and what to demand of them. This may be beneficial compared to uniform requirements if caseworkers have relevant information about how to adapt the conditionality policy. Nevertheless, the policy represents a promising avenue to explore for other countries in need of social insurance system reform.

Weekly hours of television and internet consumption in Norway 1991-2018

A couple of days ago, I blogged about time spent watching television and video by different age groups in Norway. Of course the issue of internet immediately popped up, so I made this graph showing both time spent watching television and time spent on the internet:

With regards to total screen time, note that these graphs leave out time spent watching video tapes and dvds and time spent on computers, electronic games and mobile phones without using the internet.

Time spent watching TV and video media in Norway 1991-2018

Inspired by a tweet by Gray Kimbrough graphing changes in television and video watching in the US between the mid-2000s and the mid-2010s for various age groups, I decided to follow up with a similar figure with Norwegian data. Gray showed that in the US, people aged 45 and older increased their watching substantially, while younger people decreased it at least to some extent. In Norway the picture was somewhat different – there was very little change for the oldest groups, but the youngest ones reduced their watching by much more than in the US.

Part of the reason for making the graph was to learn how to use the pcarrow option in Stata, which I accomplished, however, I found that in this case with only five groups, a simple line chart may actually provide more information and be preferable:

“Is there really an empirical turn in economics?”

The recent “empirical” turn in economics should be known as an “applied” one and it is just one in a long series of related developments. Moreover, it is a move towards the historical roots of the discipline. Those are some lessons from Beatrice Cherrier‘s essay “Is there really an empirical turn in economics?“. Based on research conducted together with Roger Backhouse, she takes issue with the idea that there has been a revolution in economic research involving empirics. Some points I liked:

  • Empirical work has been live and well, what has changed is its recent larger role in top journals. Besides, the view of theory as dominating in economics is based on looking only at the last 50 years – pre- and immediate post-war economics used to be a lot more empirical.
  • Much theory has become more applied, often involving data. And John Bates Clark medal citations stress “applied,” often taken consisting of a mix of theory and empirics.
  • Increasing availablity of data is a development that has been ongoing since at least the 1960’s. Hype around and criticism of new, large sources of data were the same in the 1970’s as today.
  • Computerization is overrated, much modern empirical work is computationally and numerically very simple.
  • Oscar Morgenstern (of von Neumann and Morgenstern‘s Theory of Games and Economic Behavior fame) proposed that to become a fellow of the Econometric Society, it should be a requirement to “have done some econometric work in the strictest sense” and be “in actual contact with data they have explored and exploited for which purpose they may have even developed new methods.”

H/t: Erwin Dekker.

Ironic debunking

Who Will Debunk The Debunkers? Daniel Engber asks in a fascinating piece at fivethirtyeight. He tells the story of “meta-skeptic” Dave Sutton, who has made it his specialty to doubt other doubters’ explanations. The first few paragraphs, about iron, prove the point that a good debunking is often too clever. Likewise with Semmelweis – the received version is probably too simple. Finally, Sutton comes off as somewhat of a megalomaniac when it comes to his work about Darwin, providing yet another layer to the story.

Most Norwegians do not ski

silly proposal to spend public money on giving everyone a type of sports equipment that in average can be used around one quarter of the year got me wondering how many Norwegian actually do ski. So I looked up some data from Statistics Norway’s survey on living conditions

skiing1997_2014

Source: Statistics Norway

More than half the population skis at all, skiing (on the extensive margin) is clearly on a downwards sloping trend, but is free skis to everyone the solution? Given that skis can be obtained nearly for free already, perhaps interest is just not that high. Better to build out opportunities for all-year activity close to where people live, restrict time spent watching television, raise sugar taxes, and get more physical activity into school.

“Can welfare conditionality combat high school dropout?”

I have a new working paper out, joint work with Simen Markussen and Knut Røed. Simen has written provocatively about the paper in the today’s Dagens Næringsliv, which is also running a companion piece. These are only in Norwegian (and behind a paywall), however, so here is a brief summary in English:

We investigate what happens when Norwegian social insurance offices increase their use of conditions would-be welfare recipients need to satisfy in order to receive welfare. Using the staggered introduction of this program and based on double and triple difference models, we find that such conditionality reduces the number of young people that receive welfare, and more importantly, increases the high school graduation rate. For young people from disadvantaged backgrounds, we find substantial and precise effects, whereas we find no effects on youth from more resourceful backgrounds, as expected. A few years later, we find that those who were exposed to new regime have more education, earn more, and are more likely to be employed. Thus even though activating these people may cost something upfront, it pays off in the long run.

The newspaper has an interview with a guy who got on track and gets some work experience through this system. Here is the abstract of the research paper:

Based on administrative data, we analyze empirically the effects of stricter conditionality for social assistance receipt on welfare dependency and high school completion rates among Norwegian youths. Our evaluation strategy exploits a geographically differentiated implementation of conditionality. The causal effects are identified on the basis of larger-thanexpected within-municipality changes in outcomes that not only coincide with the local timing of conditionality implementation, but do so in a way that correlates with individual ex ante predicted probabilities of becoming a social assistance claimant. We find that stricter conditionality significantly reduces welfare claims and increases high school completion rates.

“What’s The Point” podcast

I have started listening to a new podcast called What’s The Point, produced by Nate Silver’s fivethirtyeight team. The show “is a short weekly conversation (tag line: “Big Data. Small Interviews.”) that highlights data’s growing influence and brings in the people who are using it in surprising ways.” I have enjoyed the first few episodes and will continue to listen to the show on a regular basis. In the second episode, the guest was astrophysicist Neil deGrasse Tyson, and when talking about his multiple interests and obligations, he said something I liked very much about having too much to do: “When something is out of balance you can get quite innovative in your attempts to resolve that fact.” Anyway, the podcast is recommended.

Childhood predictors of adult outcomes

Two papers in The Economic Journal November 2014 deal with how childhood information may predict adult outcomes.

Frijters, Johnston and Shields consider the question Does Childhood Predict Adult Life Satisfaction? Using repeated surveys of people born in the UK in 1958, they are able to explain only 7 % of people’s adult life satisfaction with a very wide range of family and childhood variables. Interestingly, exploiting the panel dimension, they estimate that around 40 % of adult life satisfaction is a trait (i.e. fixed), so it is surprising that their first number is so low. It is as if type of childhood almost does not matter. Education and wages are predicted much better.

I do not know if information on time preferences would have helped, but Golsteyn, Grönqvist and Lindahl at least claim that Adolescent Time Preferences Predict Lifetime Outcomes in their article in the same issue. They find that Swedes who were future-oriented (had low discount rates) as children went on to obtain more education, better grades, higher incomes, and better health (obesity and mortality) as adults than their more impatient peers. The authors are admirably clear that they are not estimating causal effects.

Review: Intelligence: A Very Short Introduction

Since I am doing some work using intelligence test data, I wanted to read something introductory material on that topic. Enter Intelligence: A Very Short Introduction (2001) by Ian J. Deary. I found this a useful introduction to how psychologists/psychometricians have thought about these things. What I was really after was the foundational stuff in chapter 1, and that is what I will focus on here. (Though chapter 6 on the Flynn effect is also solid, and taught me that American SAT scores have been declining in the same period as IQ scores have been rising.)

Deary takes the test collection called Wechsler Adult Intelligence Scale III as a starting point. WAIS-III consists of 13 different tests, and strikingly,

“every single one of those 13 tests in the WAIS-III  has a positive correlation with every other one. People who are better at any one test tend to be better at all of the others. There are 78 correlations when we look at all the pairings among the 13 tests. Every single correlation is positive – a good score on one of the tests tends to bring with it a good score on the others. There are no tests unrelated to any other one, i.e. there are noe near-to-zero correlations. There are no tests that are negatively related with other ones. Even the lowest correlation between any two tests is still a modest 0.3 (between picture completion and digit span). […]

The first substantial fact, then, is that all of these different tests show positive associations – people good at one tend to be good at all of the others. […]

The second important fact is that some sub-groups of tests in the WAIS-III collection associate higher among themselves than with others. For example, the tests of vocabulary, information, similarities, and comprehension all have especially high associations with each other. So, although they relate quite strongly to every test in the WAIS-III collection, they form a little pool of tests that are especially highly related among themselves. The same thing occurs with digit span, arithmetic, and letter-number sequencing. They relate positively with all of the other tests in the collection, but they relate especially highly with each other (pp. 7-8).”

In the WAIS-II tests, there are four groups of tests that correlate particularly strongly (called “group factors”), labelled: Verbal comprehension, Perceptual organization, Working memory, and Processing speed, ref. the figure below (p. 3). Inline image 2

Positive correlations between the four group factors are high. This has often been taken to imply that the skills required to do well on each have some common source, which has traditionally been called g (“general factor”). Strictly speaking, the fact that the different test scores are positively correlated does not imply that they have something in common or that “g” corresponds to anything real. Deary is at one point fairly clear about this, writing: “The rectangles in Figure 1 are actual mental tests – the 13 sub-tests – that make up the Wechsler collection. The four circles that represent the ‘group factors’ and the circle that contains g are optimal ways of representing the statistical associations among the tests contained in the rectangles. The things in the circles, the specific/group factor abilities and ‘g’, do not equate to things in the human mind – they are not bits of the brain (p. 11).”

Though he muddles it somewhat when continuing with “The names we pencil into the circles are our common-sense guesses about what seems to be common to the sub-groups of tests that associate closely. The circles themselves emerged from the statistical procedures and the data, not from intuition about the tests’ similarities, but the labels we give the circles have to be decided by common sense (p.11),” and later much more by going on to treat ‘g’ as a valid stand-alone explanatory concept, and writing e.g. “We already know from Chapter 1 that there is general ability and there are […] specific types of mental ability (p. 85).”

Nevertheless, the book seems to be a good exposition of intelligence testing and how psychologists have viewed and continue to view the results of these tests.