Tag Archives: time use

Weekly hours of television and internet consumption in Norway 1991-2018

A couple of days ago, I blogged about time spent watching television and video by different age groups in Norway. Of course the issue of internet immediately popped up, so I made this graph showing both time spent watching television and time spent on the internet:

With regards to total screen time, note that these graphs leave out time spent watching video tapes and dvds and time spent on computers, electronic games and mobile phones without using the internet.

Time spent watching TV and video media in Norway 1991-2018

Inspired by a tweet by Gray Kimbrough graphing changes in television and video watching in the US between the mid-2000s and the mid-2010s for various age groups, I decided to follow up with a similar figure with Norwegian data. Gray showed that in the US, people aged 45 and older increased their watching substantially, while younger people decreased it at least to some extent. In Norway the picture was somewhat different – there was very little change for the oldest groups, but the youngest ones reduced their watching by much more than in the US.

Part of the reason for making the graph was to learn how to use the pcarrow option in Stata, which I accomplished, however, I found that in this case with only five groups, a simple line chart may actually provide more information and be preferable:

Less reading, more television

I have always liked time use surveys and would love to use them more, for example to write posts like this one at Vox. Now I have recently begun working a little with some such Norwegian surveys, so here is a little about recent developments in how young Norwegians spend their leisure time.
(Apologies for the unsatisfying look of some of the graphs, they are simply lifted from an online resource.)

figure_leisure_1970_2010

Percent spending time on various leisure activites an average day, 1970-2010.

In short, since 1970 fewer of us are reading an average day (turquoise), while more area watching television (light blue), and recently using internet (included in “Other” (dark brown)).

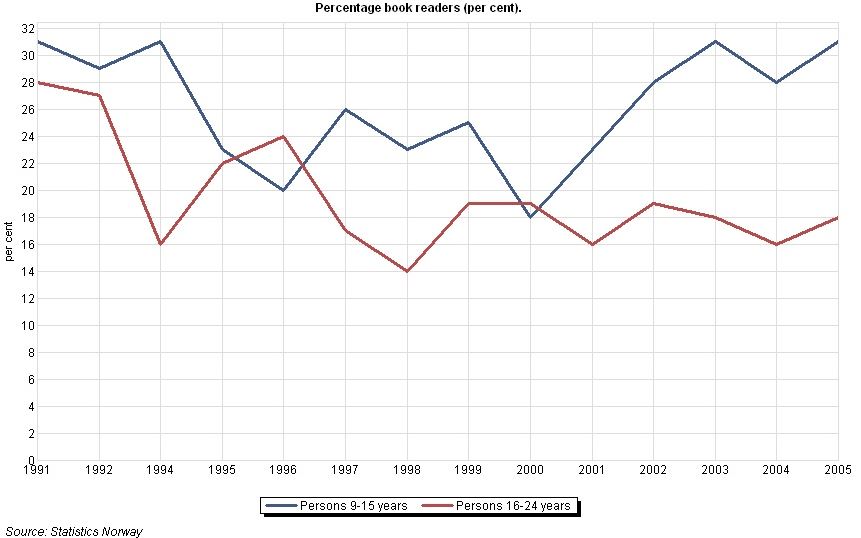
A bit more detailed look on average time for 1991-2005 confirms that television time is increasing; figure_media_minutesTVwatched1991_2005

and although there might be somewhat of a Harry Potter effect for the youngest in the beginning of the 2000’s, time spent reading is quite consistently going down, figure_media_percentagebookreaders1991_2005

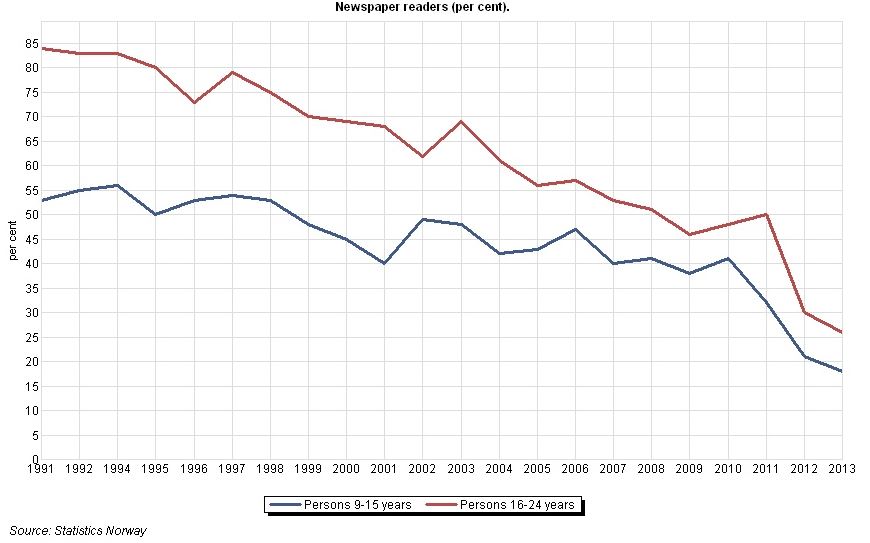
including time spent on newspapers,
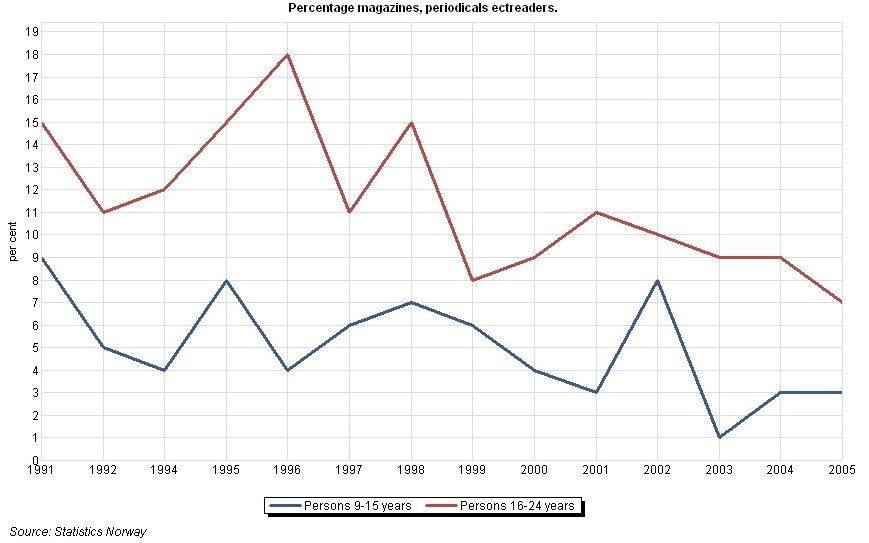
 figure_media_percentagnewspaperreaders1991_2005

magazines,    figure_media_percentagemagazinereaders1991_2005

and even cartoons. figure_media_percentagecartoonreaders1991_2005

Is that a bad thing? Well, that depends, but if it is passive television entertainment that crowds out reading, I would not be surprised if that had some long term consequences.