The telling figure below from an NBER paper (wp) by Allen, Dechov, Pope and Wu has been shared by several people this summer. From data on almost 10 million marathon finishing times, they show how people use their prospective finishing time as motivation to provide more effort and bunch at every 30 min. interval.
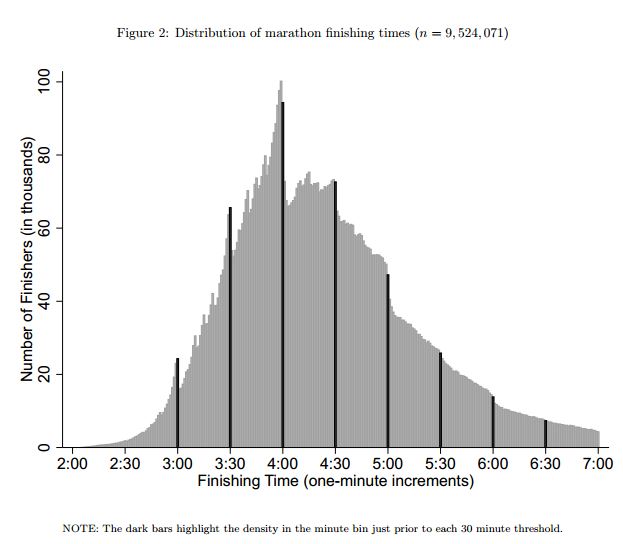
Figure 2. Distribution of marathon finishing times-Allen Dechov Pope Wu 2014 Reference-Dependent Preferences- Evidence from Marathon Runners
